
Projects
Gird-interactive System Level Energy Efficient Digital Twin
We developed a React + Vite based web dashboard that visualizes a grid-interactive manufacturing system using a model predictive control (MPC) simulation. It runs a 3-day (72-hour) synthetic digital-twin scenario and shows buffer levels, process rates, production-vs-target performance, electricity price, power demand, and energy cost through interactive charts. The goal is to give a quick operational view of throughput, energy efficiency, peak demand, and total cost in one interface.
Diffusion-Based Real-Time Electricity Price Distribution Learning
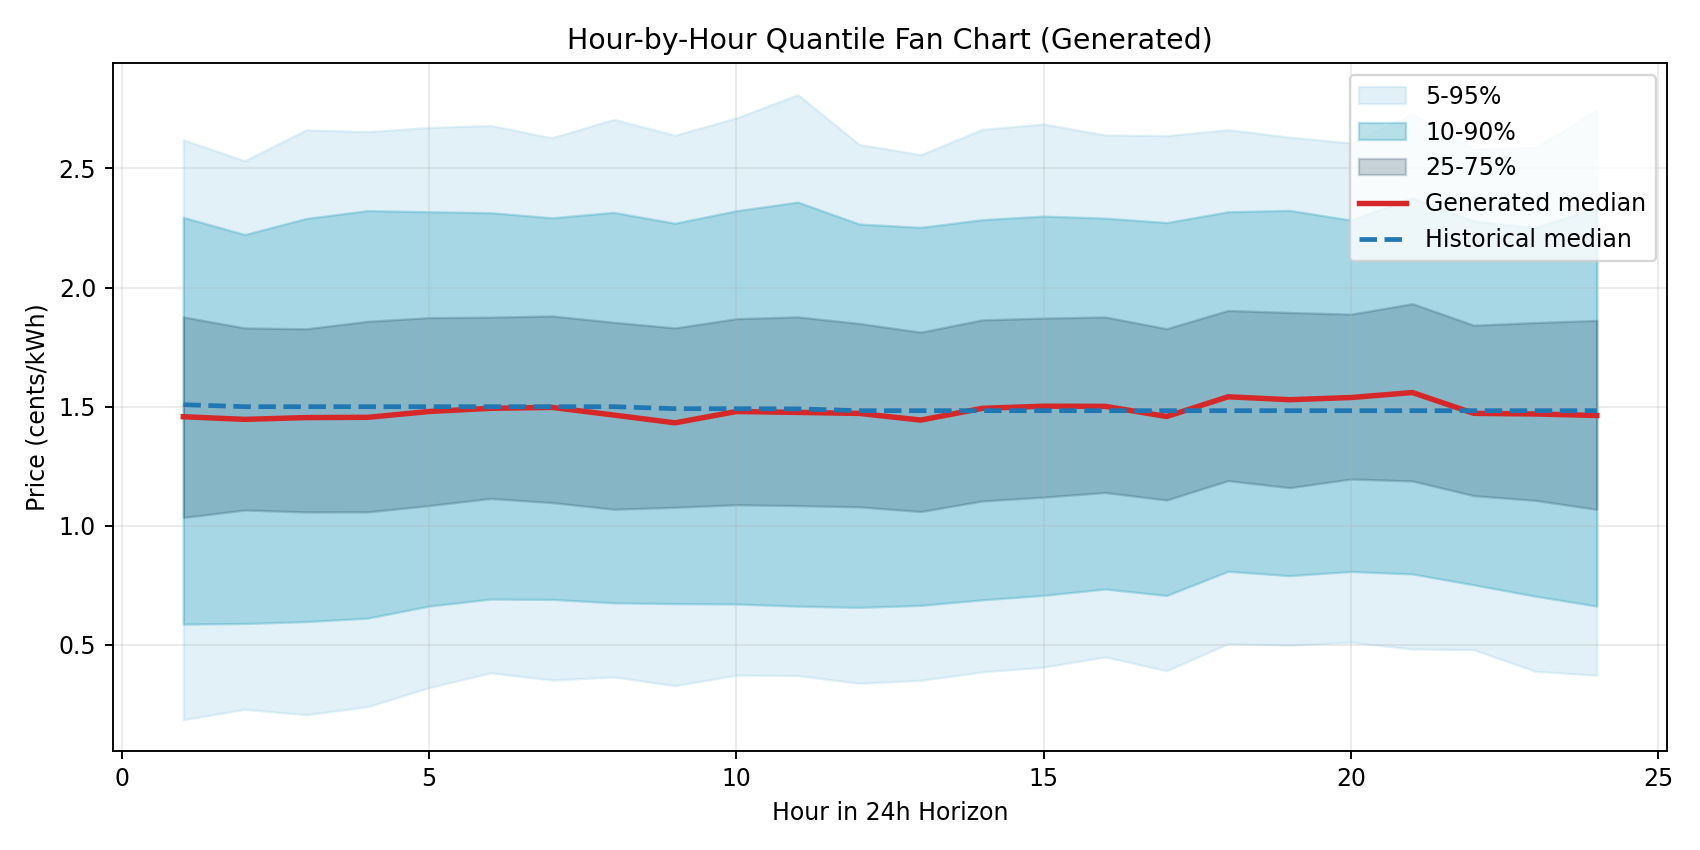
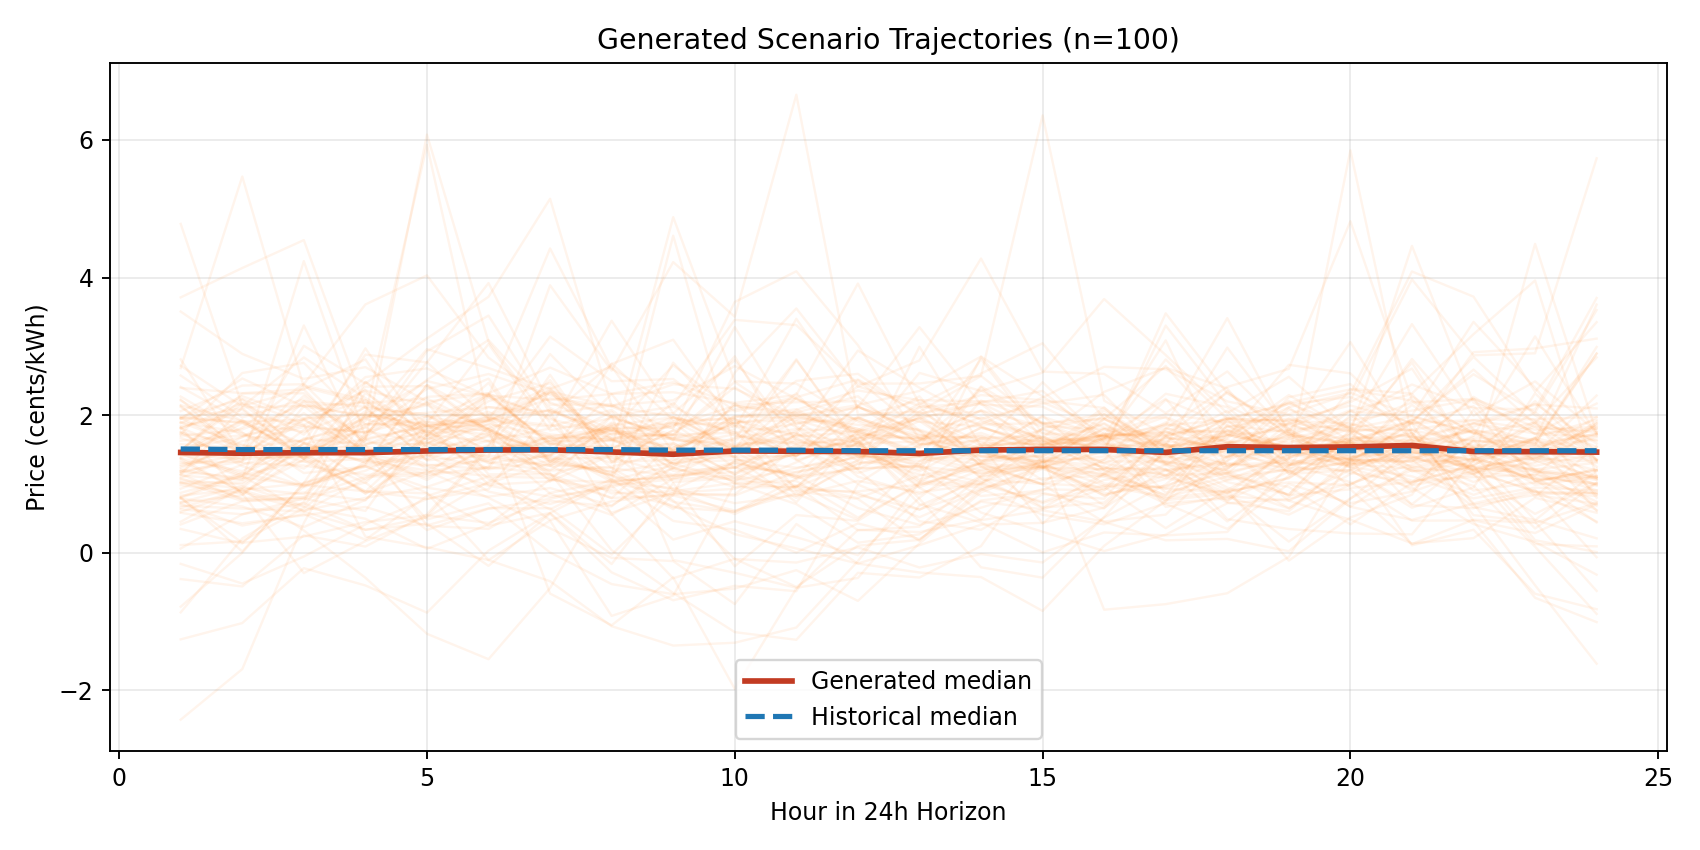
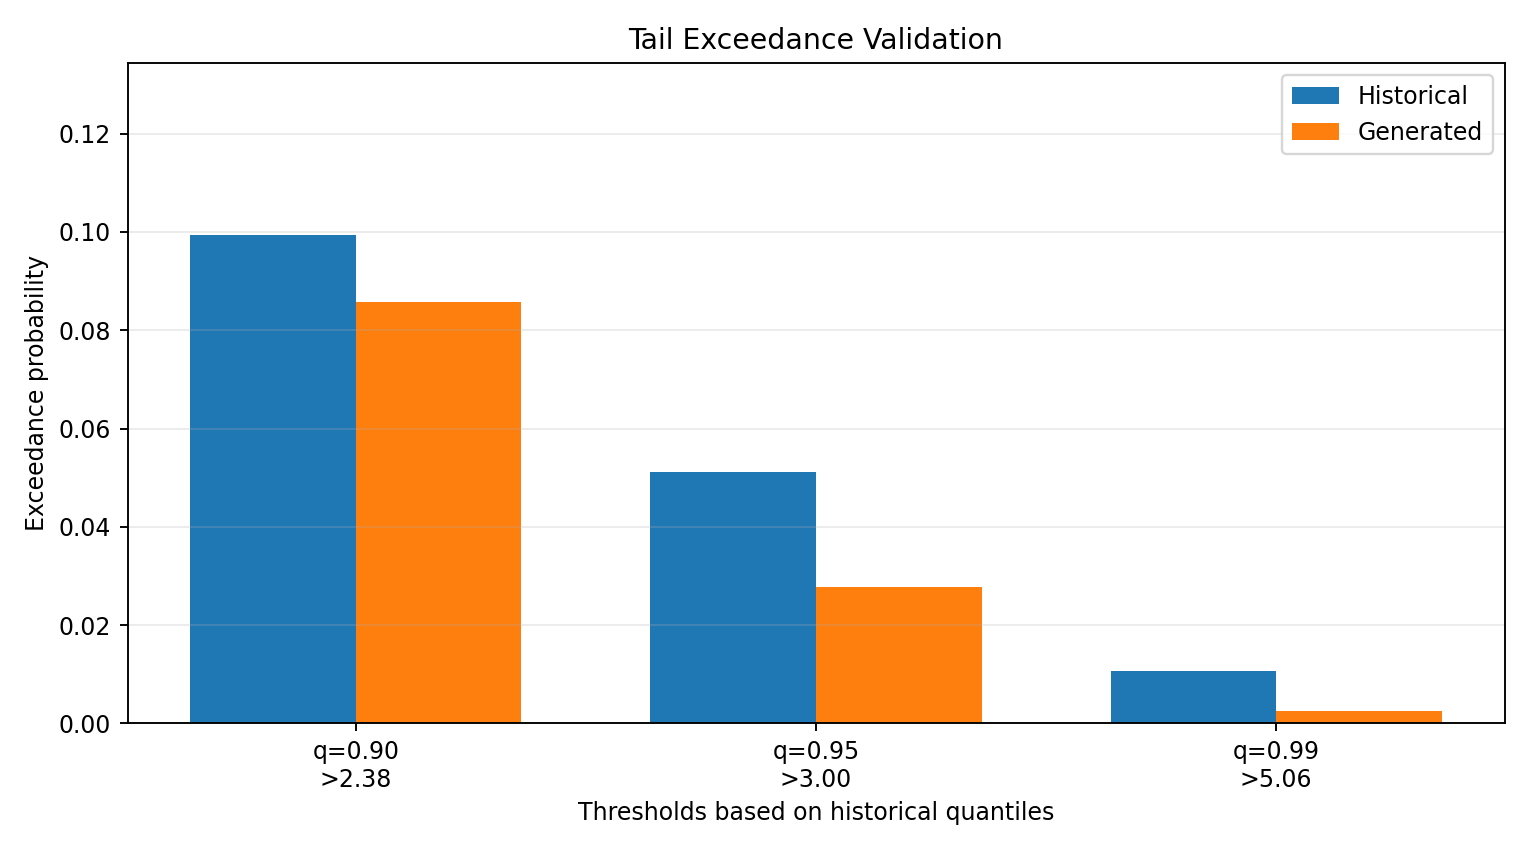
This project uses a diffusion model to learn the probability distribution of PJM real-time electricity prices and generate realistic multi-hour price scenarios. Instead of predicting only one point forecast, it produces full distributions and tail behavior, which are directly useful for stochastic and chance-constrained optimization. The workflow includes model training, scenario generation, and diagnostic visualization to check how well generated prices match historical PJM patterns. 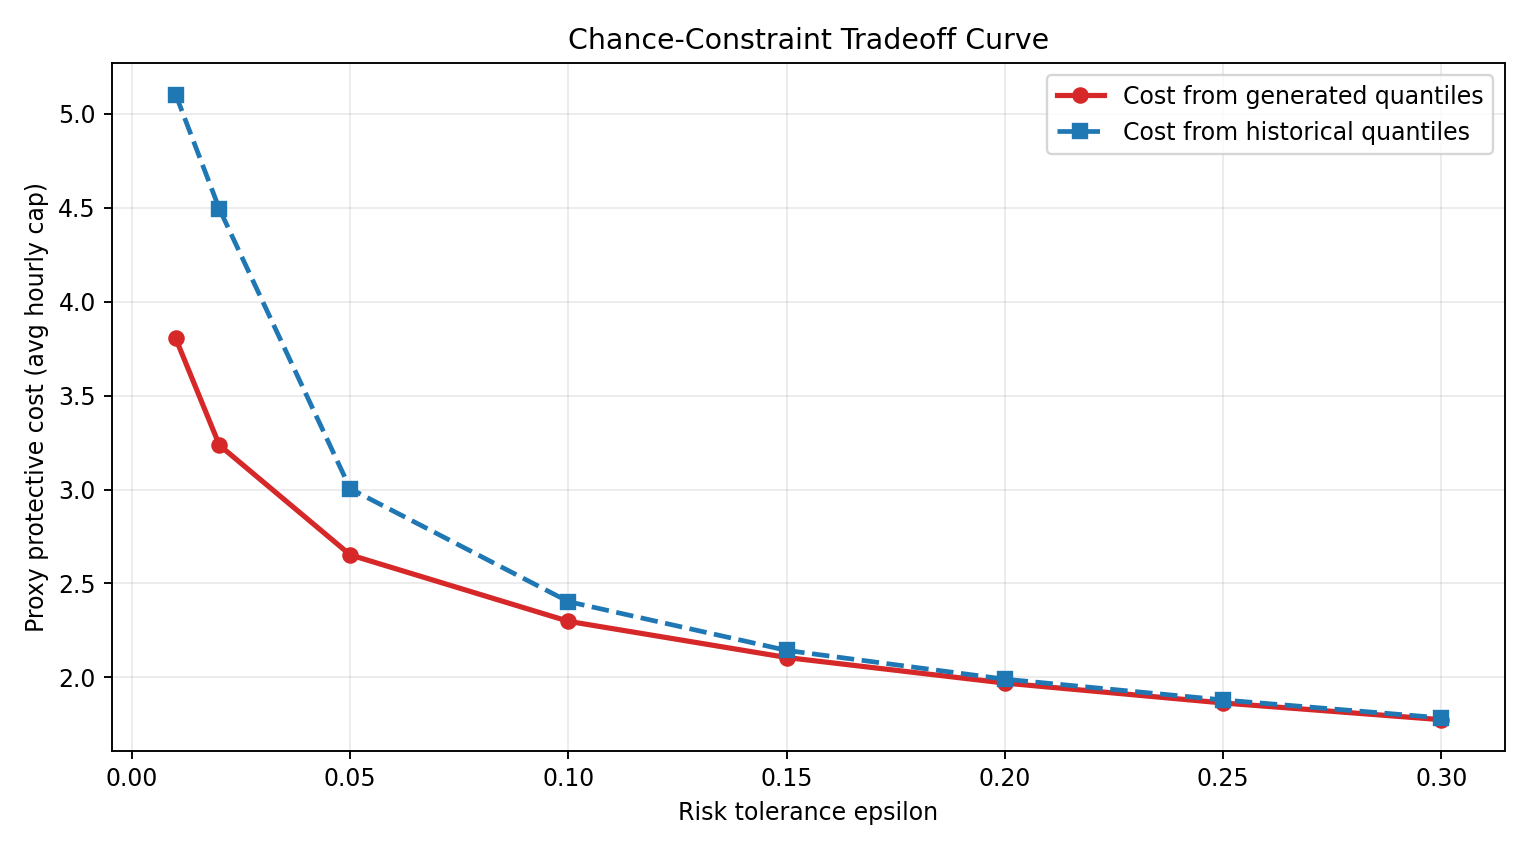
Machine Learning–Driven U.S. County Food Insecurity Prediction and Risk Index Development
This project builds a data-driven U.S. county-level Food Insecurity Index using machine learning. County socioeconomic and demographic features are modeled with XGBoost, then translated into a transparent 0–100 risk score (higher means higher risk) with SHAP-based feature weighting. The final output is an interactive map that helps policymakers and researchers quickly identify high-risk counties and support targeted interventions.
Our results align closely with USDA state-level food insecurity patterns, supporting the accuracy of our model. We extend this insight to the county level, providing more granular and actionable information for targeted local decision-making.